Selecting the right timeframe is crucial for successful forex trading, yet it’s often misunderstood. As both a trader and educator, I’ve noticed that whenever a new strategy is shared, the most common question is invariably: “What’s the best timeframe for this strategy?” Let’s demystify timeframe selection and help you make better trading decisions.
Understanding Timeframe Fundamentals
Many traders believe that changing timeframes will dramatically alter their trading results. However, this is a misconception. To understand why, let’s break down what actually creates a timeframe:
Every timeframe is built on four essential price components:
- Opening price
- Closing price
- High price
- Low price
The only difference between timeframes is how long it takes to collect these four data points. For instance, a 1-hour candlestick combines these prices over 60 minutes, while a 1-minute candlestick does the same over just 60 seconds.
The Truth About Technical Analysis Across Timeframes
Here’s something crucial for intermediate traders to understand: technical analysis concepts remain constant across all timeframes. Whether you’re looking at a 1-hour or 1-minute chart:
- Support and resistance levels exist
- Chart patterns form
- Trend lines work the same way
- Structure levels remain valid
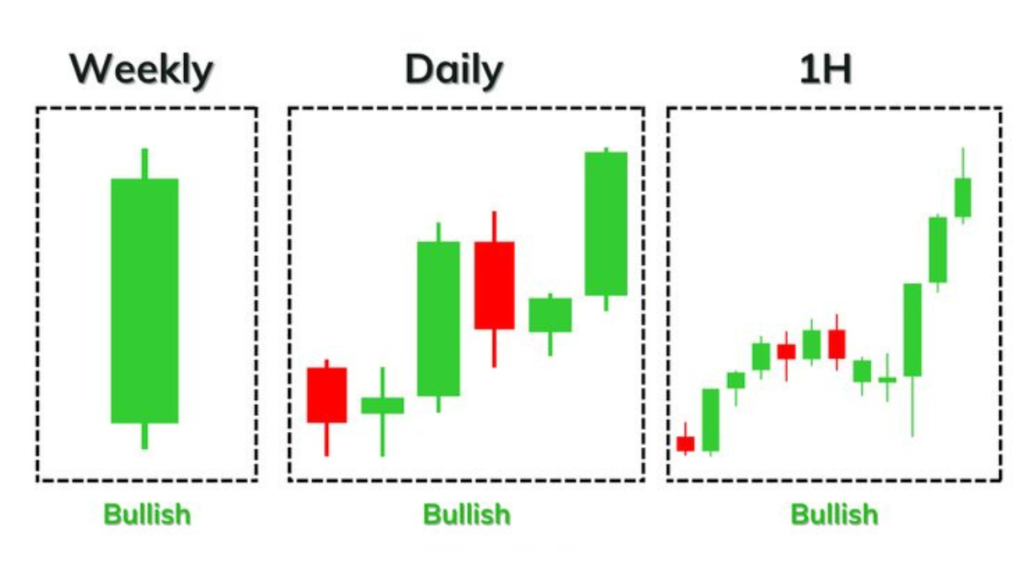
The primary difference isn’t in how these technical elements work, but in how long it takes for price movements to develop.
What Actually Changes with Different Timeframes
While your win rate might remain relatively stable across timeframes, three critical factors do change:
1. Time in Trade
Your chosen timeframe directly impacts how long you’ll hold positions:
- Scalpers (1-minute charts): Minutes or seconds
- Day traders (5-minute to 1-hour): Hours
- Swing traders (4-hour to daily): Days
- Position traders (daily to monthly): Weeks or months
2. Position Sizing and Risk Management
Timeframe selection significantly affects your position sizing:
- Shorter timeframes: Tighter stop losses (around 10 pips) allow larger position sizes
- Higher timeframes: Wider stop losses (100+ pips) require smaller position sizes
For example, if you typically risk $5 per pip on a 5-minute chart with a 10-pip stop loss ($50 risk), you’d need to adjust to perhaps $0.50 per pip on a daily chart with a 100-pip stop loss (same $50 risk).
3. Emotional Investment
The timeframe you choose directly influences your emotional engagement with the market:
- Shorter timeframes mean more trades and higher emotional involvement
- Longer timeframes allow for more detached, objective trading decisions
Recommendations for Success
To optimize your trading performance:
- Choose one timeframe and stick to it consistently. This helps you:
- Master position sizing for that specific timeframe
- Understand how your strategies perform
- Develop consistent trading patterns
- For intermediate traders looking to improve, focus on timeframes between 15-minute and 4-hour charts because:
- They offer a balanced approach to trading
- Provide enough time for analysis
- Reduce emotional trading decisions
Avoid the common trap of jumping between timeframes searching for “better” opportunities. Remember, price action patterns occur across all timeframes – the only difference is the time scale.
*And by the way, you might need these resources before you place your next trade…*
Join the best broker for low spreads here👉 https://bit.ly/JoinDerivNow
Copy Trades From Pro Traders For Free https://bit.ly/copy-trading-broker
Have a great day…
Courage